Examining the secondary structures
Using the Jmol tool, molecules can be displayed in a variety of methods, with each method demonstrating a different aspect of the structure. In this way for example, a model of the peptide chain can be displayed, the secondary structures, the atoms, the bonds between them and more. As mentioned, the default display is called Balls and Sticks, and it displays the atoms and the bonds between them. However, this display does not enable the examination of the secondary structures in the protein. There are three types of main secondary structures, and they are:
Alpha helix: as its name would suggest – is a helical structure like a spring (Figure 1). The spiral shape is formed by cyclic hydrogen bonds created between amino acids on the polypeptide chain (protein).
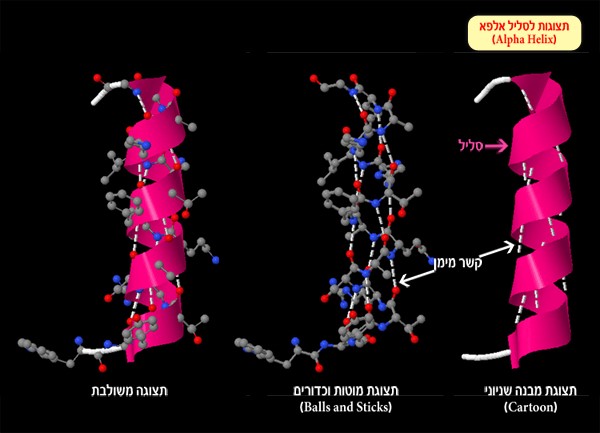
Figure 1: Alpha helix and hydrogen bonds (white dotted line) created between the oxygen atom or nitrogen atom and hydrogen atoms
Beta sheet – a sheet-like structure formed by hydrogen bonds between parallel segments of the polypeptide chain (Figure 2). Each segment in the beta sheet is called a strand.
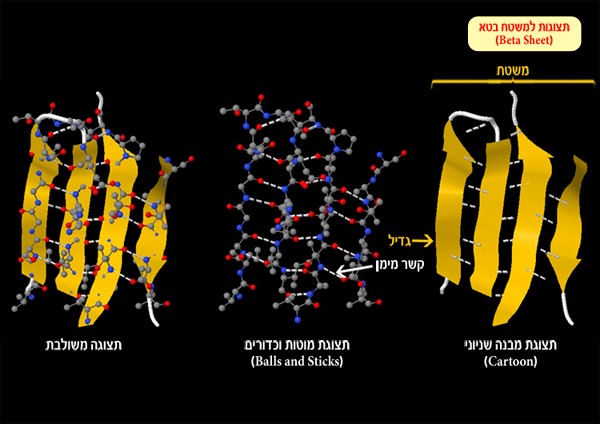
Figure 2: Beta sheet and hydrogen bonds (white dotted line) formed between an oxygen atom or nitrogen atom and hydrogen atoms
Turn and loop – these structures change the direction of the polypeptide chain (Figure 3). They can also serve as connective regions between alpha helices and beta sheets.
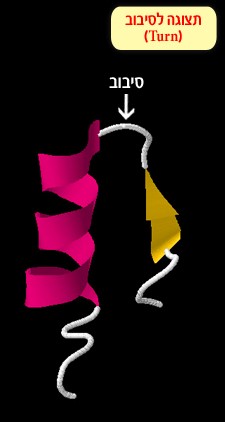
Figure 3: a turn connecting between an alpha helix and a beta sheet
Each secondary structure has a typical shape in the model, and in order to view them more easily the Jmol tool dyes (artificially of course) each secondary structure in a unique color: alpha helices appear as pink coils, beta sheets appear as a flat yellow arrow, and the areas connecting them are marked with white loops and turns. In order to display the secondary structures, choose the display called Cartoon. Right click the mouse for the additional options menu, and pick Style ➔ Scheme ➔ Cartoon:
5. Observe the display result. How many subunits comprise the protein? And how many alpha helices are there in each unit?
Choose one answer:
- The protein is comprised of one subunit with 4 alpha helices.
- The protein is comprised of 2 subunits, with 6 alpha helices in each one.
- The protein is comprised of 4 subunits. Two of them have 2 alpha helices and two of them have one alpha helix.
- The protein is comprised of 4 subunits that do not have any alpha helices.
The correct answer is: C. Four subunits are visible. Two subunits have two alpha helices and two subunits have one alpha helix (screen 5).
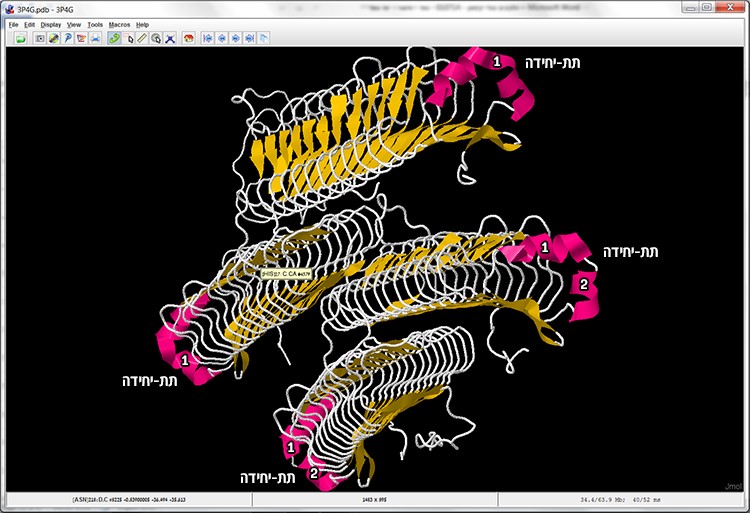
Screen 5: Cartoon display – enables quick identification of the subunits in the protein structure and the secondary structures (alpha helices and beta sheets).
The Select command
The tool also provides various ways of presenting the components in the structure, like the atoms and the chemical bonds between them, by selecting the color, size, display style and more, and even hiding them. In order to distinguish between the subunits in the structure before us, we will change the design of two out of the four subunits in the protein: subunit B will be in cyan, while in subunit C we will display the Van der Waals surface area. Each action requires two stages: in the first stage, using the Select command, we will select the desired component on which we will perform the action, and in the second stage we will perform the desired action of designing the selected component (Figure 4).
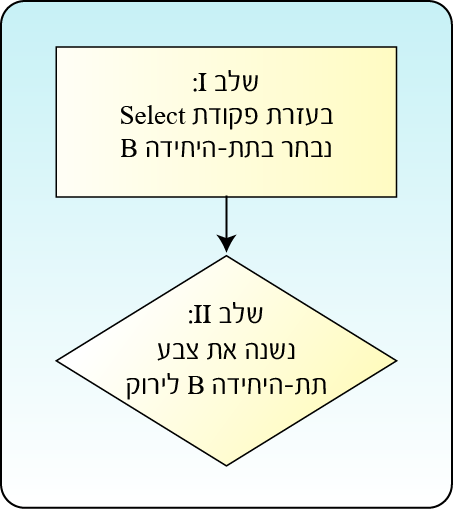
Figure 4: Performing the action requires two stages. In the first stage, using the Select command, we select the desired component on which we will perform the action, and in the second stage we perform the desired action.
The Select command allows us to select the component or part of the molecule on which we will perform the action, such as: a specific type of amino acid (for example: Proline, Histidine and more), specific types of atoms (for example: carbon atoms, oxygen and more), water molecules, ligands and more. In order to select regular structure components, such as a specific type of atom, a specific type of amino acid or according to their characteristics, it is possible to use the Select command in the additional options menu. To select a subunit or amino acid at a specific position, you must use the Select command in the console (screen 6).
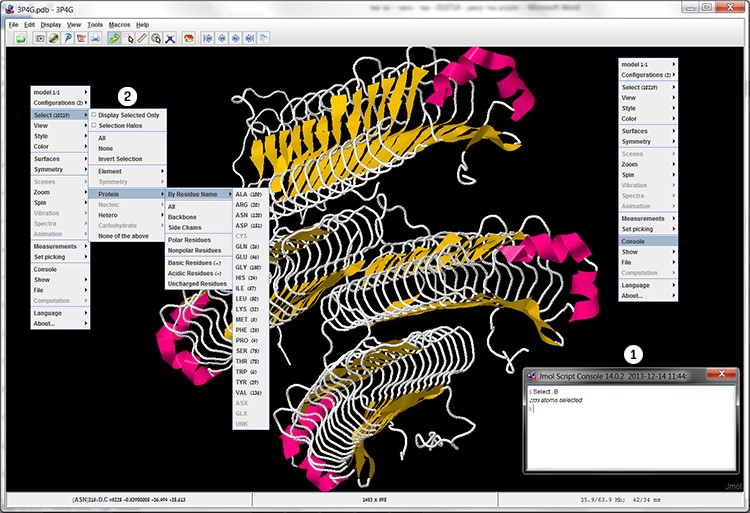
Screen 6: The Select command enables the selection of a specific component in the structure through the additional options menu (left) and through the Console (1) or alternatively through the File (2) menu, and selecting for example a specific type of amino acid through Select -> Protein-> By Residue Name.
In order to change the color of subunit B, we must perform the following:
- Right click the mouse in the workspace, and in the additional option menu pick Console:
- In the console window, right after the $ sign, type Select: B (B: the symbol of the selected subunit) and press Enter.
- The tool is showing us the number of atoms in the selected component (in this case: 2553 atoms).
- Right click the mouse in the workspace, and in the additional options menu pick
Color ➔ Structure ➔ Cartoon ➔ Cyan - The B subunit is now in Cyan (screen 7).
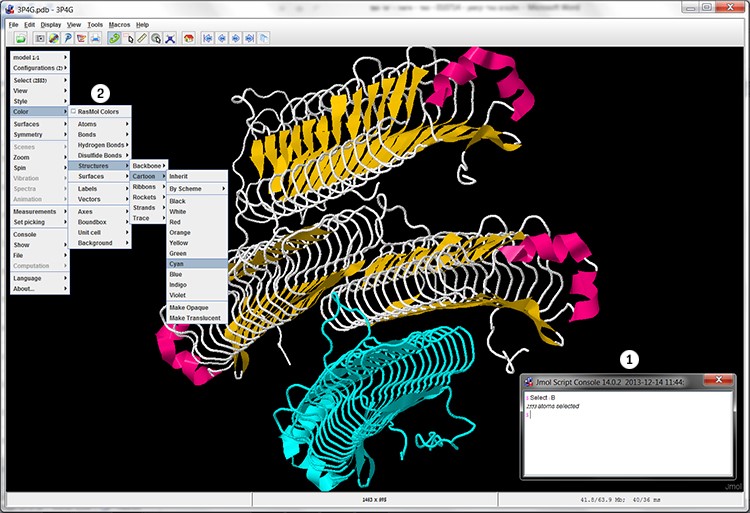
Screen 7: The cartoon display of the MpAFP after selecting subunit B (1) and dying it in cyan (2).
In the same way we will select subunit C and display the surface area of this subunit’s Van der Waals interactions.
6. What command order will display the surface area of the Van der Waals interactions in subunit C only?
Choose one answer:
- Only type in the console: Select: C.
- Type in the console: Select: C and then in the additional options menu pick Surfaces ➔ Van der Waals Surface
- First in the additional options menu pick Surfaces ➔ Van der Waals Surface and then type in the console: Select: C.
- In the additional options menu pick Surfaces ➔ Van der Waals Surface only.
The correct answer is: B. As mentioned, first you must select the desired component in the molecule using the Select command. At this stage there is no change in the display of the structure. Then, perform the desired action. In this case in the additional options menu pick Surfaces ➔ van der Waals Surfacein order to display the Van der Waals surface area (screen 8).
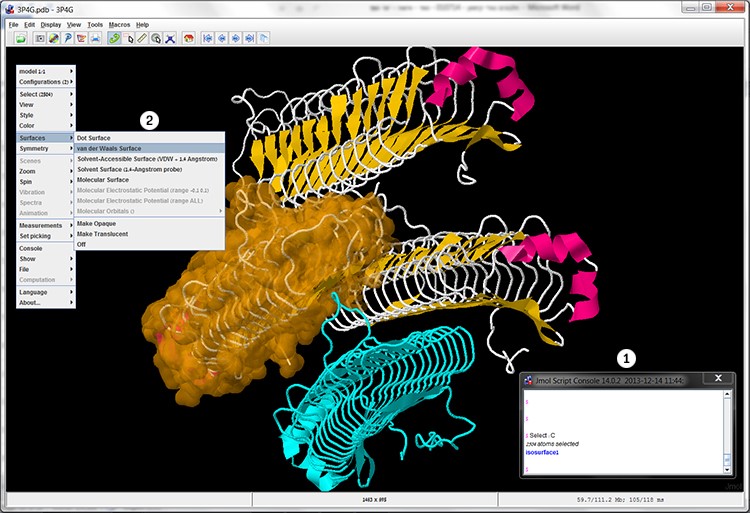
Screen 8: Cartoon display of the MpAFP after selecting and dying subunit B in Cyan, and selecting subunit C (1) and changing its display so that the surface area of the Van der Waals interactions is visible (2).
We are displaying the surface of subunit C in the protein.
The chemical groups on the surface of the protein create different types of weak chemical interactions such as Van der Waals interactions and hydrogen interactions with the molecules surrounding them.
7. Answer the following question:
The addition of the protein surface area in brown…
Choose one answer:
- Allows us to identify the outer contact area of the protein with other molecules and the types of electrical attractions in the protein’s external area.
- Allows us to identify the types of electrical attractions in the protein’s external area, but not the outer contact area of the protein with other molecules.
- Allows us to identify the outer contact area of the protein with other molecules, but not the types of electrical attractions in the protein’s external area.
- Allows us to clearly see the main structures in the secondary structure.
The correct answer is: C. As mentioned, the surface area of the protein described here is displayed in this way in order to show the areas activating electric forces on the molecules in its surrounding area. However, we cannot tell whether the groups on the surface area are hydrophilic or hydrophobic as long as the surface has not been colored in colors describing hydrophobic or hydrophilic electrical attraction.