Before you is a molecule structure file, appearing here in PDF format. Examine the open file and scroll down until the lines beginning with the word ATOM (on page 8, an example is shown in screen 1). The letters and numbers displayed before you represent
the location of each atom in the three-dimensional space, and in this way a model of the entire protein’s 3-D structure can be created.
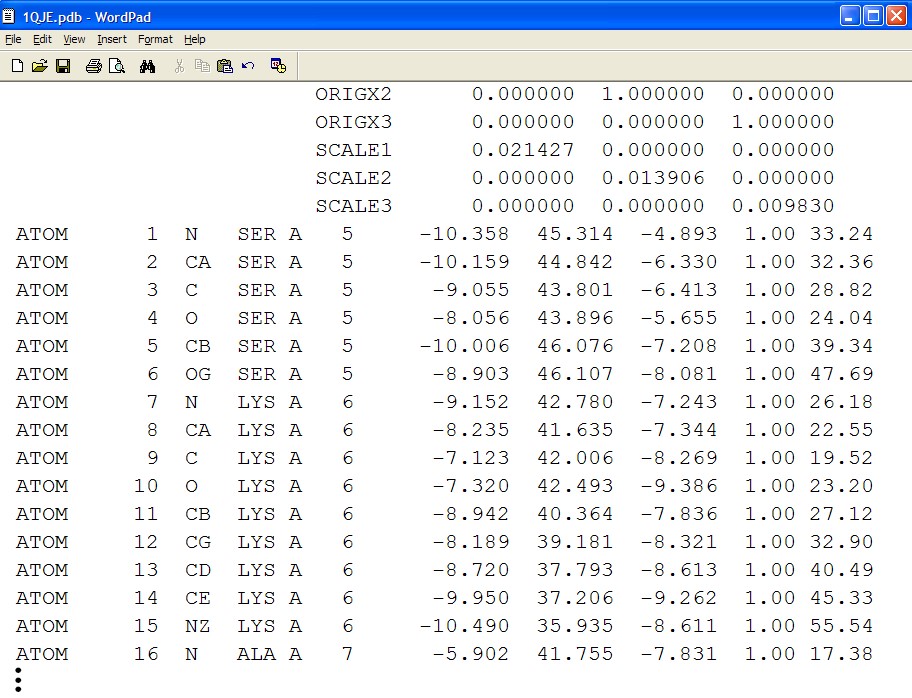
As you can see, the data in the file is not easy to understand and it is difficult to study the protein’s 3-D structure using it. In order to view the 3-D structure, we must use a special program that can interpret the data in the structure file, and
convert the numbers and letters into a spatial shape. One of the programs that can interpret this data and present the approximate protein structure is called Jmol.
On your computer, find the folder titled “Jmol”. In this folder, find the file titled Jmol.jar, the file with a mug icon; click this file and the Jmol workspace will open.
Before continuing our activity, it is recommended to watch the Jmol tool guided tour, which explains basic principles of using the tool.
In the Jmol workspace you can find the main menu bar, while right clicking the mouse will open the additional options menu (screen 2).
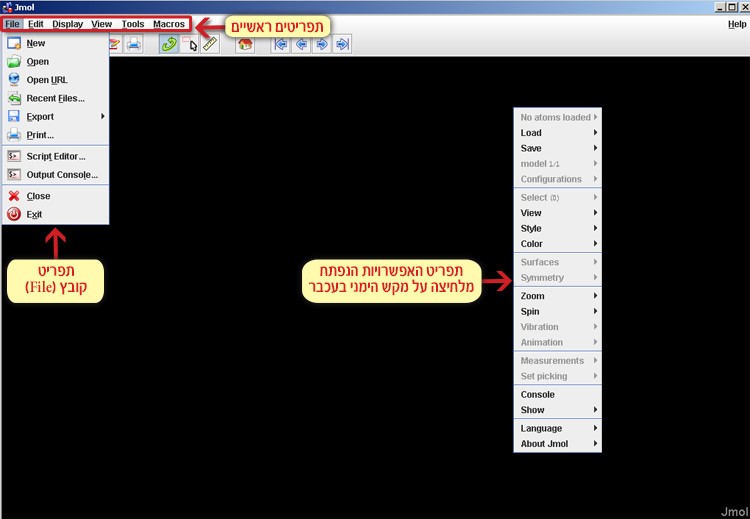
Screen 2: The menu bar (top left) and the additional options menu (on the right) opened after right clicking the mouse.
Now we will open the structure file 1QJE.pdb of the IPNS protein using the Jmol tool:
File ➔ Get PDB ➔ 1QJE.pdb
Choose File in the main menu, click Get PDB and in the dialog box that appears enter the code of the requested file 1QJE. This way the file can be opened directly from the PDB database.
Point of view – observing the protein in various displays
Balls and sticks display
The IPNS protein from the fungus Aspergillus Nidulans is presented to us in a display called Balls and Sticks (screen 3). Each atom is represented by a ball, and each covalent bond is represented by a stick. A red ball represents an oxygen atom, a blue
ball represents a nitrogen atom and a grey ball represents a carbon atom. This is a conventional color scheme called CPK after its inventors.
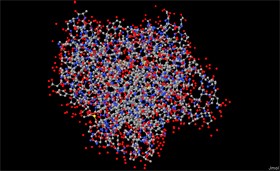
Screen 3: The IPNS protein structure – in a balls and sticks display
Later on in this task we will view various kinds of displays, each display emphasizing a different characteristic in the protein structure. One emphasizes the secondary structure of the protein, the other emphasizes the atomic volume of the protein and
so on. The protein model has many displays, but we must remember that in reality the protein molecule does not look like its representation in the model. The model is only a schematic illustration displaying the location of each atom in relation to
its neighbors. This principle can be understood when looking at different maps of the same area (Figure 2). One map emphasizes the country borders, another emphasizes the topography, and the third – the roads in the same area. Still, all these maps
are merely a model of reality, and they illustrate and emphasize a special trait in the protein. In reality if we would walk around this area we would notice houses, trees, streets and additional details, none of which were mentioned in the various
maps. This is true for the protein model as well. Each display is a type of map that emphasizes and illustrates a different trait in the protein structure, but does not represent the protein structure as it is in reality, this is only an approximate
model.
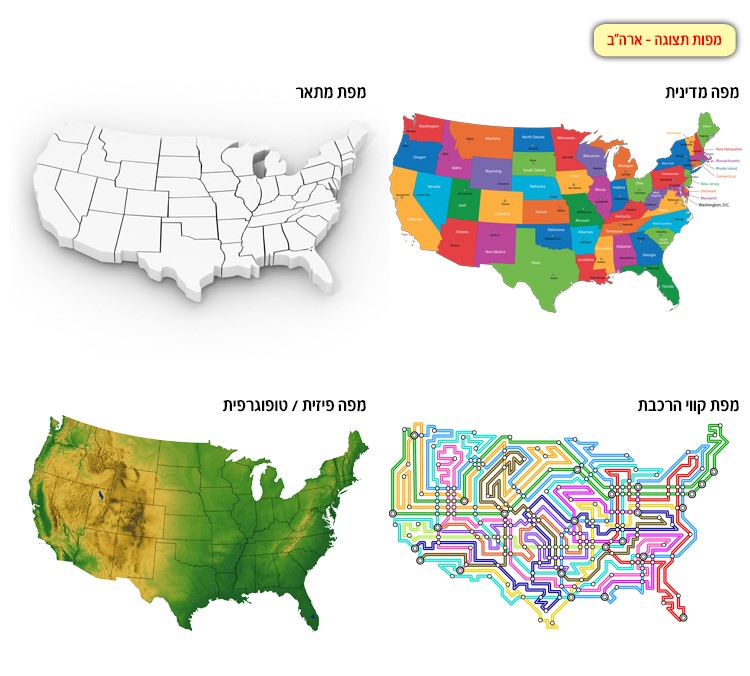
Figure 2: Various maps of the United States, each map illustrates a different trait or characteristic.
Moving the model in different directions
In order to study the protein structure we must observe it from different angles; view certain areas of the protein, and adjust the protein display zoom setting as needed. We will move the IPNS enzyme display according to the instructions in sections
1-2:
- Left click the mouse and move it right and left. Now the structure is rotating on its vertical axis. Left clicking the mouse and moving it up and down will rotate the structure on its horizontal axis. In this way we can rotate and move the structure
in different angles. - Press the scroll wheel on the mouse and scroll up and down – this action zooms in and out of the protein. You can also use the menu in order to zoom in and out of the protein. Right click the mouse and pick Zoom ➝ 200%. Change
the protein display back, so that the protein can be seen in its entirety. - For the sake of convenience, the structure can be shifted from one location on the screen to another, by pressing Ctrl and Alt and at the same time left clicking the mouse and moving it around.
| Function | Direction of protein movement |
|---|---|
| Rotating the protein on the Y axis | Left click mouse + move right and left |
| Rotating the protein on the X axis | Left click mouse + move up and down |
| Rotating the protein on the Z axis | Press Shift + left click mouse and move right and left (moving up and down will zoom in and out) |
| Zoom out/Zoom in | Scroll up and down using mouse scroll wheel Menu ➔ Zoom |
| Shifting the protein from one point to another on the screen | Press Ctrl+Alt left click mouse and move it around |